
The 3 Blood Sugar Numbers Your Doctor Probably Did Not Check #61
Why “Normal” Lab Results Miss Insulin Resistance in Women Over 40
By Leah Vachani, Certified Nutritionist, Menopause Specialist and Metabolism Coach
Last reviewed: August 2026
Part 1 of 8 in The Blood Sugar & CGM Series— an eight-part series on blood sugar, continuous glucose monitors, and taking charge of your own metabolic health. Each post stands alone, though they build in order.
Quick Answer
“Normal” on a lab report means your number falls within the range of the population that got tested — not that it is healthy. Only about one in eight American adults meets all five markers of good metabolic health, so average is a low bar. Three numbers give a clearer picture: fasting glucose, fasting insulin, and the triglyceride-to-HDL ratio. You can calculate the third one tonight from bloodwork you already have.
Where to Listen:
The information provided during this podcast is for educational purposes only. The speaker may be a licensed medical professional and may present case studies of actual patients or refer to patients' treatment during the program. Please be reminded that the Scope of Practice for Holistic Nutrition Professionals prevents us from diagnosing, preventing, treating, curing, prescribing, managing, or healing disease. Holistic Nutrition Professionals are not licensed in any state and work with clients, not patients.
What does “normal” actually mean on a lab report?
It means your number falls inside the range where most people who got tested landed. That is the entire definition. It is a statistical description of a population, not a description of health.
Nobody sat down and decided what a thriving fifty-year-old woman’s blood sugar should look like. Researchers measured a large number of people and drew lines around the middle of the distribution.
That approach would be fine if the population were healthy. It is not. Research analyzing national survey data from more than eight thousand American adults found that only 12.2% met all five criteria for optimal metabolic health— waist circumference, blood pressure, blood glucose, triglycerides and HDL — without medication holding any of them in place.
Roughly one in eight. So when your result comes back described as normal, the comparison group is a population in which seven out of eight people are not in good metabolic health.
It is also worth knowing that these ranges move. The threshold for diagnosing diabetes by fasting glucose used to be 140 mg/dL before it was lowered to 126. Hypertension thresholds have been revised downward more than once. That is science updating as it should — but it should change how much authority you hand to a line on a page.
Why is a fasting glucose of 97 worth paying attention to?
Fasting glucose measures the sugar in your blood after eight to twelve hours without food. It appears on almost every panel you have ever had, so you probably already have yours.
Notice the timing. This is your blood sugar at its calmest — no breakfast, no coffee, none of the day’s stress. It is your body on its best behavior.
The standard range runs to 99. What we look for is 70 to 90.
That difference is not cosmetic. A study following more than 46,000 people whose fasting glucose wasunder100 found that those sitting between 95 and 99 were 2.33 times more likely to develop type 2 diabetes than those under 85. The 90 to 94 group were around 49% more likely. Every single point of fasting glucose raised risk by about 6%, after adjusting for age, sex, weight, blood pressure, lipids and smoking.
Everyone in that study was normal.
One caution: fasting glucose moves. Poor sleep raises it. Stress raises it. Illness raises it. A single reading is one moment, not a pattern. If you can pull three or four years of results from your patient portal, line them up and look at the direction of travel. A number that has walked from 84 to 88 to 92 to 96 tells you something no single result can — and every one of those would have been marked normal.
What is fasting insulin, and why isn’t it on standard bloodwork?
Glucose tells you the result. Insulin tells you the effort.
Think of your house in winter. The thermostat reads 68 degrees. That number alone does not tell you whether the furnace is idling comfortably or running flat out to hold the line. Same reading, very different situations — and only one of those houses has a problem coming.
In insulin resistance, your cells gradually stop responding well to insulin’s signal, so your pancreas compensates by producing more. For years, sometimes many years, that compensation works and your glucose stays normal. Ralph DeFronzo, whose2009 Banting Lecture is among the most influential papers in the field, has spent decades making this point: insulin resistance shows up long before blood sugar does.
So why isn’t it standard? Screening guidelines are built to diagnose disease, not to detect the slow slide toward it. Fasting glucose and A1c answer “does this person have diabetes?” Fasting insulin answers “is this person on their way” — a different question, and historically not the one a short appointment is designed to ask. There is also a genuine limitation: insulin assays are not standardized between laboratories the way glucose is, so results do not always line up neatly across labs.
There is no agreed optimal range for fasting insulin. Dr. Ben Bikman — a professor of cell biology and physiology at Brigham Young University who directs a lab studying insulin resistance, obesity and mitochondrial function — uses roughly under 6 as doing well, 7 to 17 as the moment to start making changes, and above 18 as start today. Those are his numbers, though. No medical body has set an official range, and he runs a research lab and is not a physician. I use his bands as a guide because they are the most useful thing anybody has put out there. Just know that is what they are: a guide.
Even without a perfect cutoff, the number is revealing. A fasting insulin of 20 alongside a fasting glucose of 90 tells you a story glucose alone never would: things look calm, and your body is working very hard to keep them that way.
How do you calculate your triglyceride-to-HDL ratio?
Divide your triglycerides by your HDL. That is it. If your triglycerides are 120 and your HDL is 60, your ratio is 2.
You almost certainly already have both numbers from a standard lipid panel, which means this one costs you nothing and requires nobody’s permission.
It works because when insulin runs high, the liver produces more triglycerides while HDL tends to fall. The two move in opposite directions, and the ratio captures that drift better than either number alone. Research from a Stanford group led by Tracey McLaughlin, published in the Annals of Internal Medicine, identified a ratio of3 or above as a practical marker of insulin resistance in overweight adults. In metabolic health practice, most of us look for lower — under 2, and under 1.5 is genuinely good.
Here is why the ratio catches what individual numbers hide. Two women both have triglycerides of 140 — inside the standard range, since nothing gets flagged until 150. The first has an HDL of 70, giving a ratio of 2. The second has an HDL of 35, giving a ratio of 4. Identical triglycerides, the same reassuring word at the top of the page, and completely different metabolic pictures.
Does the triglyceride-to-HDL ratio work for everyone?
No, and this is rarely mentioned.
A study from the National Institutes of Health, published in the Archives of Internal Medicine, tested these lipid criteria specifically in African American adults and found they did not hold up. The criteria identified only about one in six of the participants who were genuinely insulin resistant — statistically close to a coin toss. The researchers who originally developed the ratio published a follow-up agreeing it does not translate to that population.
Triglyceride levels tend to run lower in African American adults even when insulin resistance is present, so the ratio stays low and the problem stays hidden.
In that same study, fasting insulin, body mass index, and waist circumference all tracked insulin resistance well — fasting insulin especially. If you are Black, do not read a reassuring ratio as an all-clear. Fasting insulin is your number.
What should you do with these three numbers?
Find your last fasting glucose and write it down. If it is in the nineties, that is information rather than a diagnosis. It means this is worth watching.
Calculate your triglyceride-to-HDL ratio from labs you already have. Under 2 is the target. If you are Black, do not rely on this one — go straight to the next step.
Ask for fasting insulin by name at your next blood draw. Of everything here, this is the one that changes what you can see.
These are targets to work toward, not a report card. A single reading is one moment; what matters is the direction you are heading, and every one of these numbers responds to what you do. If you find something you were not expecting, the right response is curiosity rather than fear.
What can’t these numbers tell you?
They can tell you there is something worth investigating. They cannot tell you what is driving yours.
Two women can arrive at the same fasting insulin for completely different reasons. One is not sleeping. One is under relentless stress. One is eating in a way that stopped suiting her body six years ago. One has been slowly losing muscle since her early forties and nobody mentioned it. Same number, different route in, different way out.
That gap is where personalized work begins — and it is why a number on a page, however good, is a starting point rather than an answer.
Continue the series
This is part 1 of 8. Next: why insulin resistance has become so common in perimenopause, and what is driving it. See the full series.
Resources
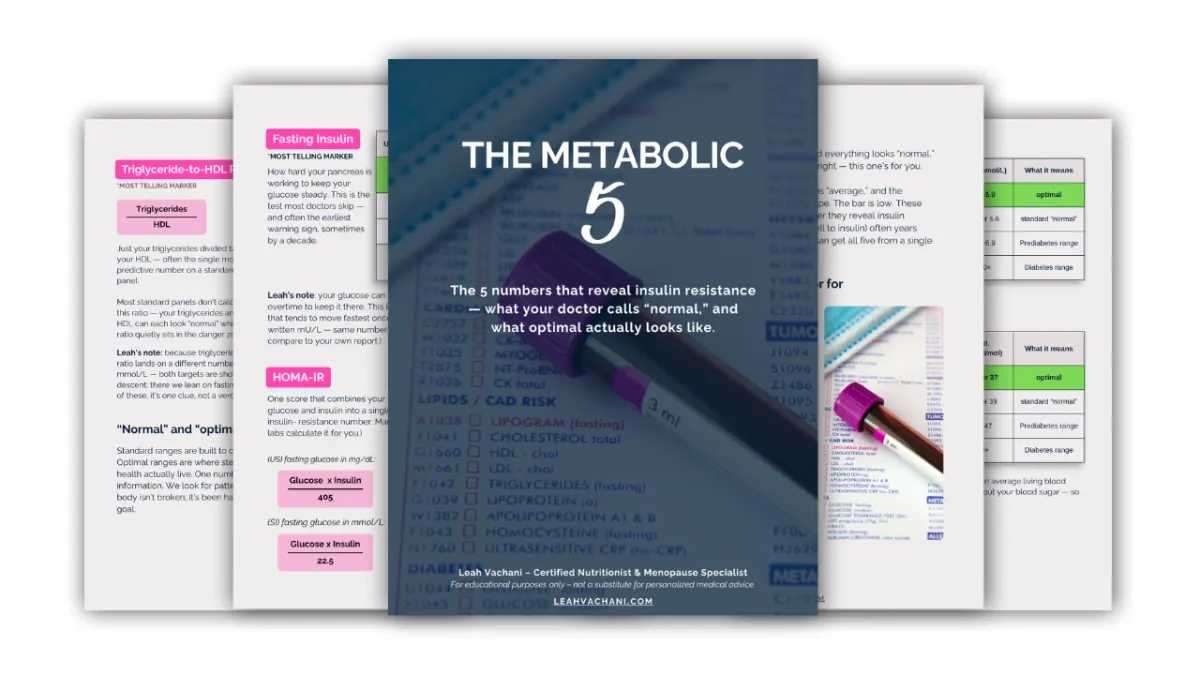
The Metabolic Five— my free guide to every metabolic test worth asking for, what optimal looks like for each, and a printable list to take to your appointment. Download it here.
Clarity— my program for reading your own real-time glucose data. It comes in a few different ways: on your own, in a small group, or one-on-one with me. See current availability.
Sources
Araújo J, Cai J, Stevens J. Prevalence of Optimal Metabolic Health in American Adults: NHANES 2009–2016.Metabolic Syndrome and Related Disorders, 2018.
Nichols GA, Hillier TA, Brown JB. Normal fasting plasma glucose and risk of type 2 diabetes diagnosis.The American Journal of Medicine, 2008.
Tirosh A, Shai I, Tekes-Manova D, et al. Normal fasting plasma glucose levels and type 2 diabetes in young men.New England Journal of Medicine, 2005.
McLaughlin T, Abbasi F, Cheal K, et al.Use of metabolic markers to identify overweight individuals who are insulin resistant.Annals of Internal Medicine, 2003.
Sumner AE, Finley KB, Genovese DJ, Criqui MH, Boston RC. Fasting triglyceride and the triglyceride-HDL cholesterol ratio are not markers of insulin resistance in African Americans. Archives of Internal Medicine, 2005.
DeFronzo RA. Banting Lecture. From the triumvirate to the ominous octet. Diabetes, 2009.
Medical disclaimer
A quick note from me: I’m a certified nutritionist and menopause specialist, but I’m not your doctor — and this article isn’t a substitute for personalized medical care. The information here is meant to inform and empower you, not replace a conversation with your healthcare provider. Always check in with your team before making changes to your diet, supplements, or lifestyle. Take what serves you, leave what doesn’t, and trust yourself.